
The setup
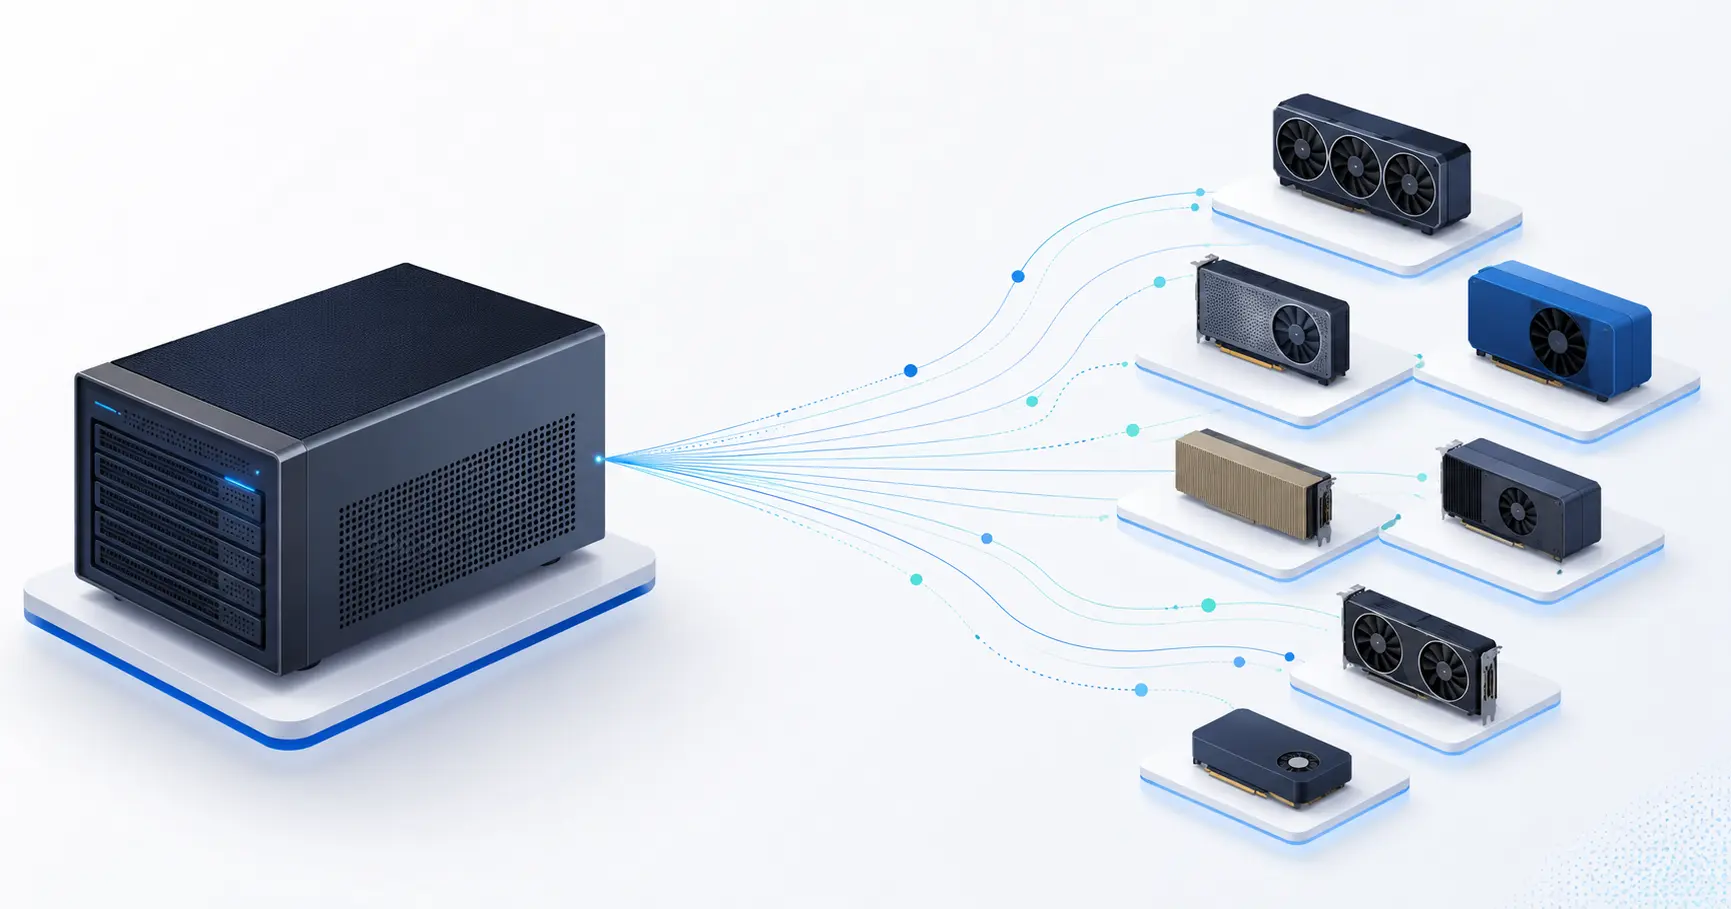
We run inference on a decentralized fleet of consumer hardware: single RTX 4090s, multi-GPU rigs of 3090s and 3060s on plain PCIe (no NVLink), Tesla P100s, a few Macs. No two nodes are alike. The task: serve a 27B dense coding model (Qwen3.6-27B, AWQ-INT4, ~17 GB of weights) for tool-calling agents, across whatever hardware shows up.
This is a write-up of what actually broke, with numbers. None of it is model-specific — it applies to anyone serving large models on mixed GPUs.
1. The obvious sizing formula silently under-provisions
The intuitive way to decide how many GPUs a model needs:
gpus = ceil(model_vram / usable_vram_per_gpu)
This is wrong, and it fails silently — it returns a number that looks reasonable and then OOMs at load time.
The reason: not all of a model's memory shards. Pipeline parallelism splits weights across GPUs (each GPU holds a slice of the layers). But a chunk of per-GPU memory does not shard: the CUDA/runtime context, activation peak during the forward pass, the embedding and LM-head tensors (they live whole on the first/last pipeline stage), CUDA-graph capture buffers, and the minimum KV cache vLLM needs to start at all.
So per-GPU need at N GPUs is roughly:
per_gpu ≈ shardable / N + fixed_floor
The formula above assumes fixed_floor = 0. On big GPUs you get away with it. On small ones you don't. Concrete: our planner computed "needs 2 GPUs" for the 27B on a 12 GB card. At pipeline-parallel size 2, each card got ~9 GB of weights, then vLLM tried to allocate the 2.4 GB LM head — and died with CUDA out of memory at exactly self.lm_head = ParallelLMHead(...). Two GPUs of 12 GB "should" hold a 17 GB model. They don't, because ~5 GB per card never divided.
The fix is not a better constant — it's accepting that the right GPU count must be discovered, not computed from one number. Start from the real weight size (a fact you can read from the safetensors index without downloading anything), pick a deliberately generous initial split, and if it OOMs at startup, escalate to more GPUs and retry — then remember what worked for that (model, GPU type, runtime) tuple so you only pay the discovery cost once.
2. Pipeline parallelism is nothing like the throughput benchmarks
Everyone benchmarks tensor parallelism on NVLink. Almost nobody publishes pipeline-parallel numbers on plain PCIe consumer cards, which is what a decentralized fleet actually has.
Measured, same model, same prompt, same 220-token output:
| Config | Throughput |
|---|---|
| 1× RTX 4090, CUDA graphs | 44.7 tok/s |
| 1× RTX 4090, eager | 20 tok/s |
| 8× RTX 3060, PP=4, eager | 14 tok/s |
| 8× RTX 3060, PP=8, CUDA graphs | 17 tok/s |
Two things to take from this:
CUDA graphs are a single-GPU win. Turning them on doubled the 4090 (20 → 44.7 tok/s, +124%). On the 8-GPU pipeline it added almost nothing (14 → 17, +22%). The reason: CUDA graphs optimize per-GPU kernel launch overhead, but a PCIe pipeline's bottleneck is the bubble — GPUs idling while activations cross the bus between stages. You can't graph your way out of a communication-bound pipeline. If your fleet is multi-GPU PCIe, don't trade memory for CUDA graphs; you're paying with KV-cache space for a 22% gain.
More GPUs is not more speed for PP. PP=8 was only marginally faster than PP=4, and a single 4090 with graphs beat both 8-GPU configs by 2.5×. Pipeline parallelism is a way to fit a model that doesn't fit, not a way to go faster. Use the fewest stages that fit, not the most.
3. CUDA graphs vs eager is a memory–speed trade, and it's brutal
Removing --enforce-eager (enabling CUDA graphs) on the tight 24 GB node didn't just speed it up. It collapsed the KV cache from 8,624 tokens to 3,136 tokens — because CUDA-graph capture buffers ate the memory vLLM would otherwise give to KV. 2.2× faster, but with a context window too small for an agentic coding session whose system prompt and tool schemas alone run several thousand tokens.
So the "best" runtime setting is not a property of the model. It's a property of the node and the use case: a roomy single GPU serving short chats wants CUDA graphs; a memory-tight node serving long-context coding wants eager. The same model wants opposite settings on different hardware. Any single static value in a shared config is wrong somewhere.
4. The gotchas nobody writes down
gpu-memory-utilizationis checked against free VRAM, not total. vLLM 0.19 aborts before loading ifutil × total > free. On a WSL2/Docker Desktop box, ~1.5 GB is gone to the desktop before you start — a 24 GB card has ~22.4 GB free.--gpu-memory-utilization 0.95fails the preflight there with a confusing error that looks like an OOM but isn't.- A multi-GPU node can serve more context than a single bigger GPU. Counterintuitive: 8× 3060 at PP=4 had 21,168 tokens of KV vs 8,624 on the single 4090, because splitting the weights frees per-GPU room for KV. The "weak" node was the long-context node.
- Your CDN/WAF probably blocks your own SDK. Requests with a
Python-urllibuser agent got HTTP 403 from the WAF in front of the inference endpoint whilecurlsailed through. A valid API key doesn't help if the edge drops you for looking like a bot. Set a normal user agent in your client. - If you run the same model on many nodes, your logs must be keyed by node. We streamed container logs into a Redis key named after the model. Every node running that model wrote into the same stream, interleaved, capped at 1000 lines — so a crash on node A got evicted by node B's chatter, and attribution was guesswork. Keying logs
node:modelinstead ofmodelturned crash diagnosis from divination into a lookup. This is the single highest-leverage thing we changed.
5. The actual lesson
Every parameter we tried to set centrally — GPU count, eager vs graphs, max context length, memory utilization — turned out to be a node-local decision that no single shared value can get right across heterogeneous hardware. The model should declare intent (which weights, that it's a coding model, a speed-vs-context preference). The node should derive execution from its own hardware, observe the real result, correct on failure, and remember.
That's not a config tweak. It's a different control model: stop predicting, start observing. The fleet's hardware is too varied to predict; it is not too varied to measure.
— Notes from running it. The self-correcting scheduler described here is partly shipped (automatic GPU-count selection) and partly still being built (the escalation-and-remember loop). We'll write that up when it's real, not before.