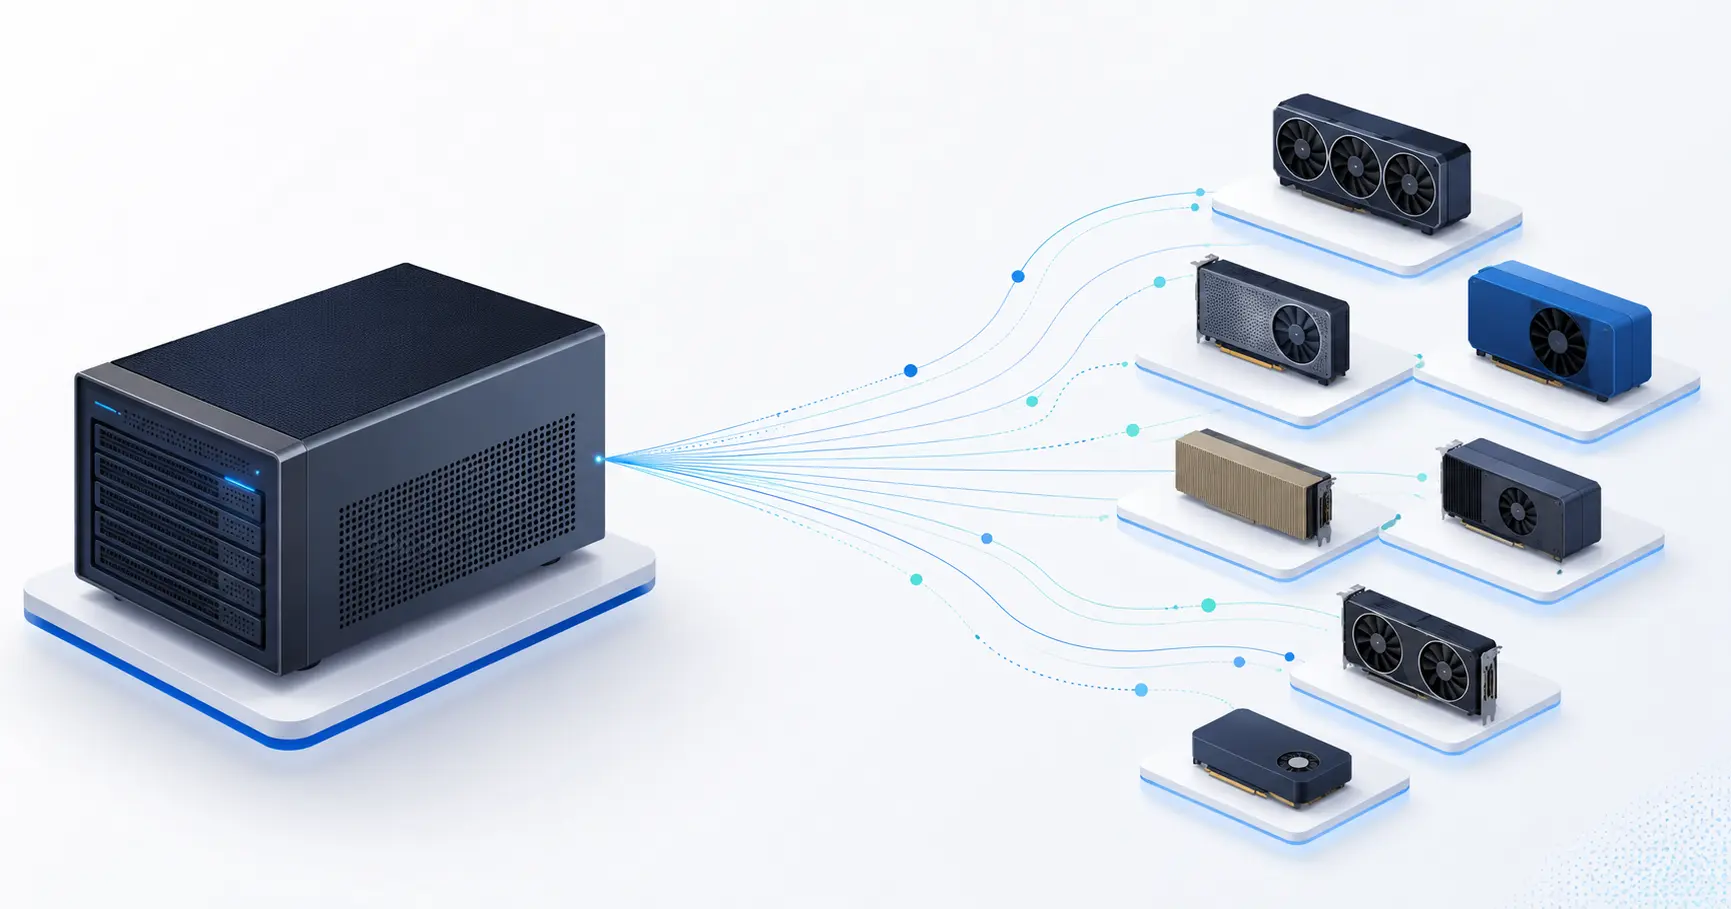


The second question in a conversation cost 0.54 seconds on one GPU and 2.56 seconds on another. Same prompt, same model, same fleet, seconds apart. The difference was not the hardware. It was that one of them had already seen the beginning of that conversation and the other had not.
This is the story of a provider's observation, the measurements that confirmed it, the routing we built because of it, and the finding we did not expect: the model most of our traffic uses appeared to get nothing from any of it — until we found the two arguments vLLM does not set for you.
The observation
A provider running nodes on our network wrote in, roughly: when my requests keep landing on the same node, answers come back much faster; when they get routed elsewhere, everything is processed again.
He was describing prefix caching. vLLM keeps the KV blocks of a prompt on the GPU that computed them and reuses them when a request arrives with the same beginning. A chat is exactly that shape: turn two is turn one plus a few hundred tokens. If it lands on the same worker, prefill is skipped for everything but the new tail.
Our router did not know any of this. It used power-of-two-choices on load: pick two workers at random, take the less loaded one. Good for balance, blind to what each GPU remembers.
Measuring it
A 5,629-token prompt, one word of output, then the same conversation grown one turn at a time. Several workers serve this model; two of them took part in this run. Timings are the request duration our API records, so they include everything the client would feel.
| turn | worker | prompt tokens | time |
|---|---|---|---|
| 1 (cold) | A | 5,629 | 6.30 s |
| 2, one turn appended | A | 5,818 | 0.54 s |
| 3, one more turn | B | 6,007 | 2.56 s |
| a different conversation | B | 5,703 | 2.28 s |
| 4, one more turn | B | 6,172 | 0.42 s |
Read it twice. Turn 2 stayed on worker A and cost 0.54 s. Turn 3 was sent to worker B, which had never seen the conversation, and paid 2.56 s — about what a brand-new prompt of that size costs there. Turn 4 stayed on B, which by then had the prefix, and cost 0.42 s.
So the cache is worth roughly an order of magnitude on every follow-up, and the router was throwing it away every time it switched workers.
What we built
The reference design for this is a cache-aware router that keeps a radix tree of prefixes per worker and routes by longest match. We had two constraints that made a straight copy wrong.
Constraint one: two routers. Our inference API runs as two instances behind nginx so deploys have no downtime. Two independent trees would disagree with each other, and a request's second turn would land wherever the load balancer happened to send the HTTP connection. Any per-instance memory has to be shared.
Constraint two: the hot path. Routing happens on every request, including tiny ones. A design that asks Redis to walk a tree pays a network round trip to save prefill it may not even find.
What we ended up with keeps the answer a radix tree gives and drops the tree:
- The first 32 KB of a request — tools, then messages in order — is cut into 512-byte blocks.
- Each block gets a cumulative hash:
h(i) = H(h(i-1), block i). A worker that served a prompt therefore ownsh(1)…h(n). - The longest prefix shared with a new request is the deepest hash that worker owns. That is a flat map lookup per block: no pointers, no tree walk, no allocation.
- Appending a turn leaves every earlier hash untouched, which is exactly why a growing chat keeps its worker.
Each decision is recorded locally and published on a Redis channel; the other instance applies it. Lookups stay in memory, and a lost message costs a cache miss rather than a wrong answer. In production the second instance routed turn 3 of a conversation it had never served, on the strength of a message from the first:
[PREFIX] hit: 905487f1 keeps 64/64 blocks (slots=0 min=0 slack=3, ~12952 tokens)
Preference, never a queue
A cached worker that is busy is not worth waiting for: queueing behind three requests costs more than the prefill it saves. So the cache only ever breaks a tie among workers that already passed every other filter — ready, serving the model, context window large enough, a free slot — and only while it carries at most a few more in-flight requests than the freest candidate. How many depends on the prompt, because that is what the saving depends on: nothing extra below 1k tokens, up to four more above 32k.
Two more rules keep it honest. Entries carry the worker's registration timestamp, so a worker that restarted — empty cache — stops matching. And the index is bounded: 200k blocks, oldest evicted, nothing older than 90 minutes considered.
After
The same five-turn conversation, on production, after the change:
| turn | worker | prompt tokens | time |
|---|---|---|---|
| 1 (cold) | A | 5,669 | 6.34 s |
| 2 | A | 5,853 | 0.52 s |
| 3 | A | 6,037 | 0.72 s |
| 4 | A | 6,214 | 0.98 s |
| 5 | A | 6,407 | 1.20 s |
Every turn stayed where the cache was. The slow climb from 0.52 s to 1.20 s is the conversation itself getting longer — new tokens still have to be prefilled, just not the old ones.
The part we did not expect
We ran the same test against the 27B model that serves most of our chat traffic, Qwen3.8-27B. Same prompt, three times in a row, one worker, seconds apart:
| run | prompt tokens | time |
|---|---|---|
| identical, 1 | 10,175 | 3.07 s |
| identical, 2 | 10,175 | 3.22 s |
| identical, 3 | 10,175 | 3.21 s |
| a different prompt | 10,135 | 3.13 s |
Repeating a prompt cost exactly what a new one cost. The prefix cache was returning nothing — not "less than we hoped", but nothing.
The architecture makes that plausible. Qwen3.8-27B is a hybrid: of its 64 layers, 16 run full attention and 48 run Gated DeltaNet, a linear-attention mechanism with a constant recurrent state, the family Mamba belongs to. A recurrent state is not a set of per-token KV blocks you can cut in half and reuse, so prefix caching for hybrid models is a different, harder problem, and the upstream tracker carries reports of hit rates collapsing to zero on exactly this architecture.
We checked the archive rather than trusting one test. Across a week of real traffic on this model, follow-up requests that happened to land on the same worker as their predecessor took 512 ms per 1,000 input tokens; those that landed elsewhere took 455 ms. Statistically indistinguishable — which is exactly what "no cache" looks like from the outside, and it held over thousands of requests, not three.
Plausible is not the same as true, so we stopped timing things and read what the engine says about itself at startup.
The flag vLLM does not set for you
Same vLLM version, same fleet, two models, two lines from the engine's own config dump:
qwen3-3b     …  enable_prefix_caching=True   …
qwen3.8-27b  …  enable_prefix_caching=False  …
We never passed that flag either way. vLLM decides: on a hybrid model prefix caching is off unless you ask for it, because the only implemented way to reuse a recurrent state is a mode the project still marks experimental. Asking takes two arguments, not one:
--enable-prefix-caching --mamba-cache-mode align
align is the half that is easy to miss. Its default is none, and on a hybrid model --enable-prefix-caching on its own has no mode in which to keep the recurrent state. The engine started and said so itself:
Warning: Prefix caching in Mamba cache 'align' mode is currently enabled.
Its support for Mamba layers is experimental. Please report any issues you may observe.
With it on
One 13,056-token prompt, repeated, against a second worker still running the old configuration. The two machines are different cards, so read each column against itself rather than against the other:
| request | worker with the flag | worker without it |
|---|---|---|
| a new prompt | 4.67 s | 7.23 s |
| the same prompt again | 1.72 s | 7.24 s |
| and again | 1.61 s | 7.23 s |
| a different prompt | 4.37 s | — |
| that one again | 1.41 s | — |
| back to the first prompt | 1.47 s | — |
The right-hand column is the flat line we had measured before: three identical requests, 7.23 / 7.24 / 7.23 s, agreeing to the second decimal. The left-hand column drops to about a third on every repeat, including a repeat that came after a different prompt had been through in between. vLLM's own counter moved from 0.0% to 46.3%.
Through the public API, a five-turn conversation of that size on the hybrid model now behaves the way the dense one does:
| turn | prompt tokens | time |
|---|---|---|
| 1 (cold) | 6,550 | 2.49 s |
| 2 | 6,597 | 1.09 s |
| 3 | 6,619 | 1.26 s |
| 4 | 6,649 | 1.19 s |
| 5 | 6,672 | 1.36 s |
All five turns landed on one worker, and the router's log says why — keeps 64/64 blocks on each of them. Two turns were routed by one replica and two by the other, each acting on what the other had published.
The second flag: where a hit is allowed to land
The win above is real, and for a while we thought it was the whole story. It is not, and the gap shows up exactly where most chat traffic lives.
Prefix caching reuses whole blocks, and on a hybrid model the block is large. vLLM sizes it so the attention page is at least as big as the Mamba page, and fp8 halves the bytes per token — so it needs twice as many tokens to get there. Our workers say so at startup: 1600 tokens per block with fp8, 800 without it. Anything shorter than one block has no complete block to reuse.
Measured on one worker, three conversations of four turns each, every turn on the same machine:
| conversation | turn 1 | turn 2 | turn 3 | turn 4 |
|---|---|---|---|---|
| ~1,200 tokens | 0.80 s | 0.80 s | 0.85 s | 0.84 s |
| ~1,550 tokens | 0.96 s | 1.02 s | 0.99 s | 1.02 s |
| ~3,100 tokens | 1.81 s | 1.95 s | 1.88 s | 1.88 s |
Flat. An ordinary chat gets nothing — including the 3,100-token one, which does contain a complete block. The benefit only appeared above roughly 6,000 tokens, where several blocks line up.
The fix is not to drop fp8. That would halve the KV cache and force max_num_seqs below the Mamba block count, and all it buys is an 800-token block instead of 1600. vLLM has a knob for exactly this problem:
--prefix-match-unit 32
It sets the finest token boundary a cache hit may land on, independently of the physical block, as long as every block size divides by it — 1600 does. It changes where a match can land, not how often state is stored, and that turns out to be enough: in align mode the Mamba state is written at the end of each scheduler step, which is where the previous turn of a conversation ended. The checkpoint the next turn needs already exists; before this flag, matching could only land on multiples of 1600 and never reached it.
Same worker, same conversations, after:
| conversation | turn 1 | turn 2 | turn 3 | turn 4 |
|---|---|---|---|---|
| ~1,200 tokens | 0.85 s | 0.85 s | 0.24 s | 0.26 s |
| ~1,550 tokens | 1.00 s | 1.00 s | 0.29 s | 0.31 s |
| ~3,100 tokens | 0.99 s | 1.05 s | 0.27 s | 0.28 s |
A quarter of the time, on the prompt sizes people actually send. It costs no memory and no concurrency; it is one argument.
The first two turns of each conversation stay slow, consistently across repeats, and that is worth understanding rather than smoothing over: Mamba state blocks are few — 127 on these cards, the same number that made the model refuse to start earlier in this story — so three conversations interleaved evict each other's state, and only the ones written during the current round are still there. Live conversations keep their cache; dormant ones do not. That is the right priority, but it is a ceiling, not an unlimited cache.
Experimental means measure it yourself
The upstream tracker carries a specific warning for our exact combination: prefix caching together with MTP speculative decoding has corrupted a small fraction of responses on hybrid models — empty content, or a run of exclamation marks, with no error raised anywhere. A silent 1% is worse than a slow 100%, so we tested for it before leaving the flag on: 150 requests sharing a 13,000-token prefix, each ending in a different arithmetic question whose answer we could check exactly.
150 correct, nothing malformed, nothing empty. We ran it again through the public API after the third flag went in, since the configuration it was testing had changed: 150 requests over a shared 3,000-token prefix, all served by one worker, median 0.88 s — 150 correct again, 0 malformed, for five cents of our own credits.
At that sample size this bounds the rate below roughly 2% rather than proving zero, so it stays on the list to re-check as traffic accumulates. It is the reason each flag went in behind a measurement instead of a hunch.
A detour worth reporting
Before we read the config dump, we suspected the KV cache dtype: --kv-cache-dtype fp8 and prefix caching have a documented history of not working together. We removed it, and the worker refused to start:
ValueError: max_num_seqs (128) exceeds available Mamba cache blocks (127).
Each decode sequence requires one Mamba cache block, so CUDA graph capture
cannot proceed.
fp8 was not just halving KV memory — it was freeing exactly enough for the 128 Mamba state blocks our concurrency setting demanded. Take it away and the model will not load at all. The fix is one number, but the lesson is that on hybrid models the memory budget has two separate consumers, and the error you get names only one of them.
The suspicion was not entirely wrong, either. Upstream notes that fp8 lowers the hit rate, so the 46% we see with it still on is probably a floor rather than a ceiling. Finding out costs a second experiment — lower max_num_seqs far enough that the Mamba blocks fit without fp8 — and that one we have not run yet.
What this cost and what it is worth
The router is about 300 lines, with unit tests for the parts that are easy to get subtly wrong: that a growing conversation keeps its hashes, that a partially shared prompt matches only as far as it truly shares, that a restarted worker stops matching, that the index respects its memory ceiling. A regression test sends a prompt and a follow-up and fails if they land on different workers.
On the dense model, the saving on an ordinary follow-up turn is between 2 and 6 seconds of prefill. On the hybrid model it was nothing at all until three arguments went in — two to enable the cache, one to let a hit land where the state actually is — and an ordinary chat turn now costs about a quarter of what it did.
That is the part we would have missed by trusting the timings alone. A 0% hit rate reads like a limit of the architecture, and the architecture does make it hard — but what we were actually measuring was a default. The engine had written the reason in its own startup log, in a line nobody reads, while we were busy timing requests against it. Before you conclude that a model cannot do something, check whether your server was asked to let it.
Paralon serves open models over an OpenAI-compatible API on a network of independent GPU owners. If you want to repeat these measurements, the endpoint is documented here, a free key covers 250,000 tokens, and the prompts above are just repeated words — the effect does not need anything clever.